Trace every call
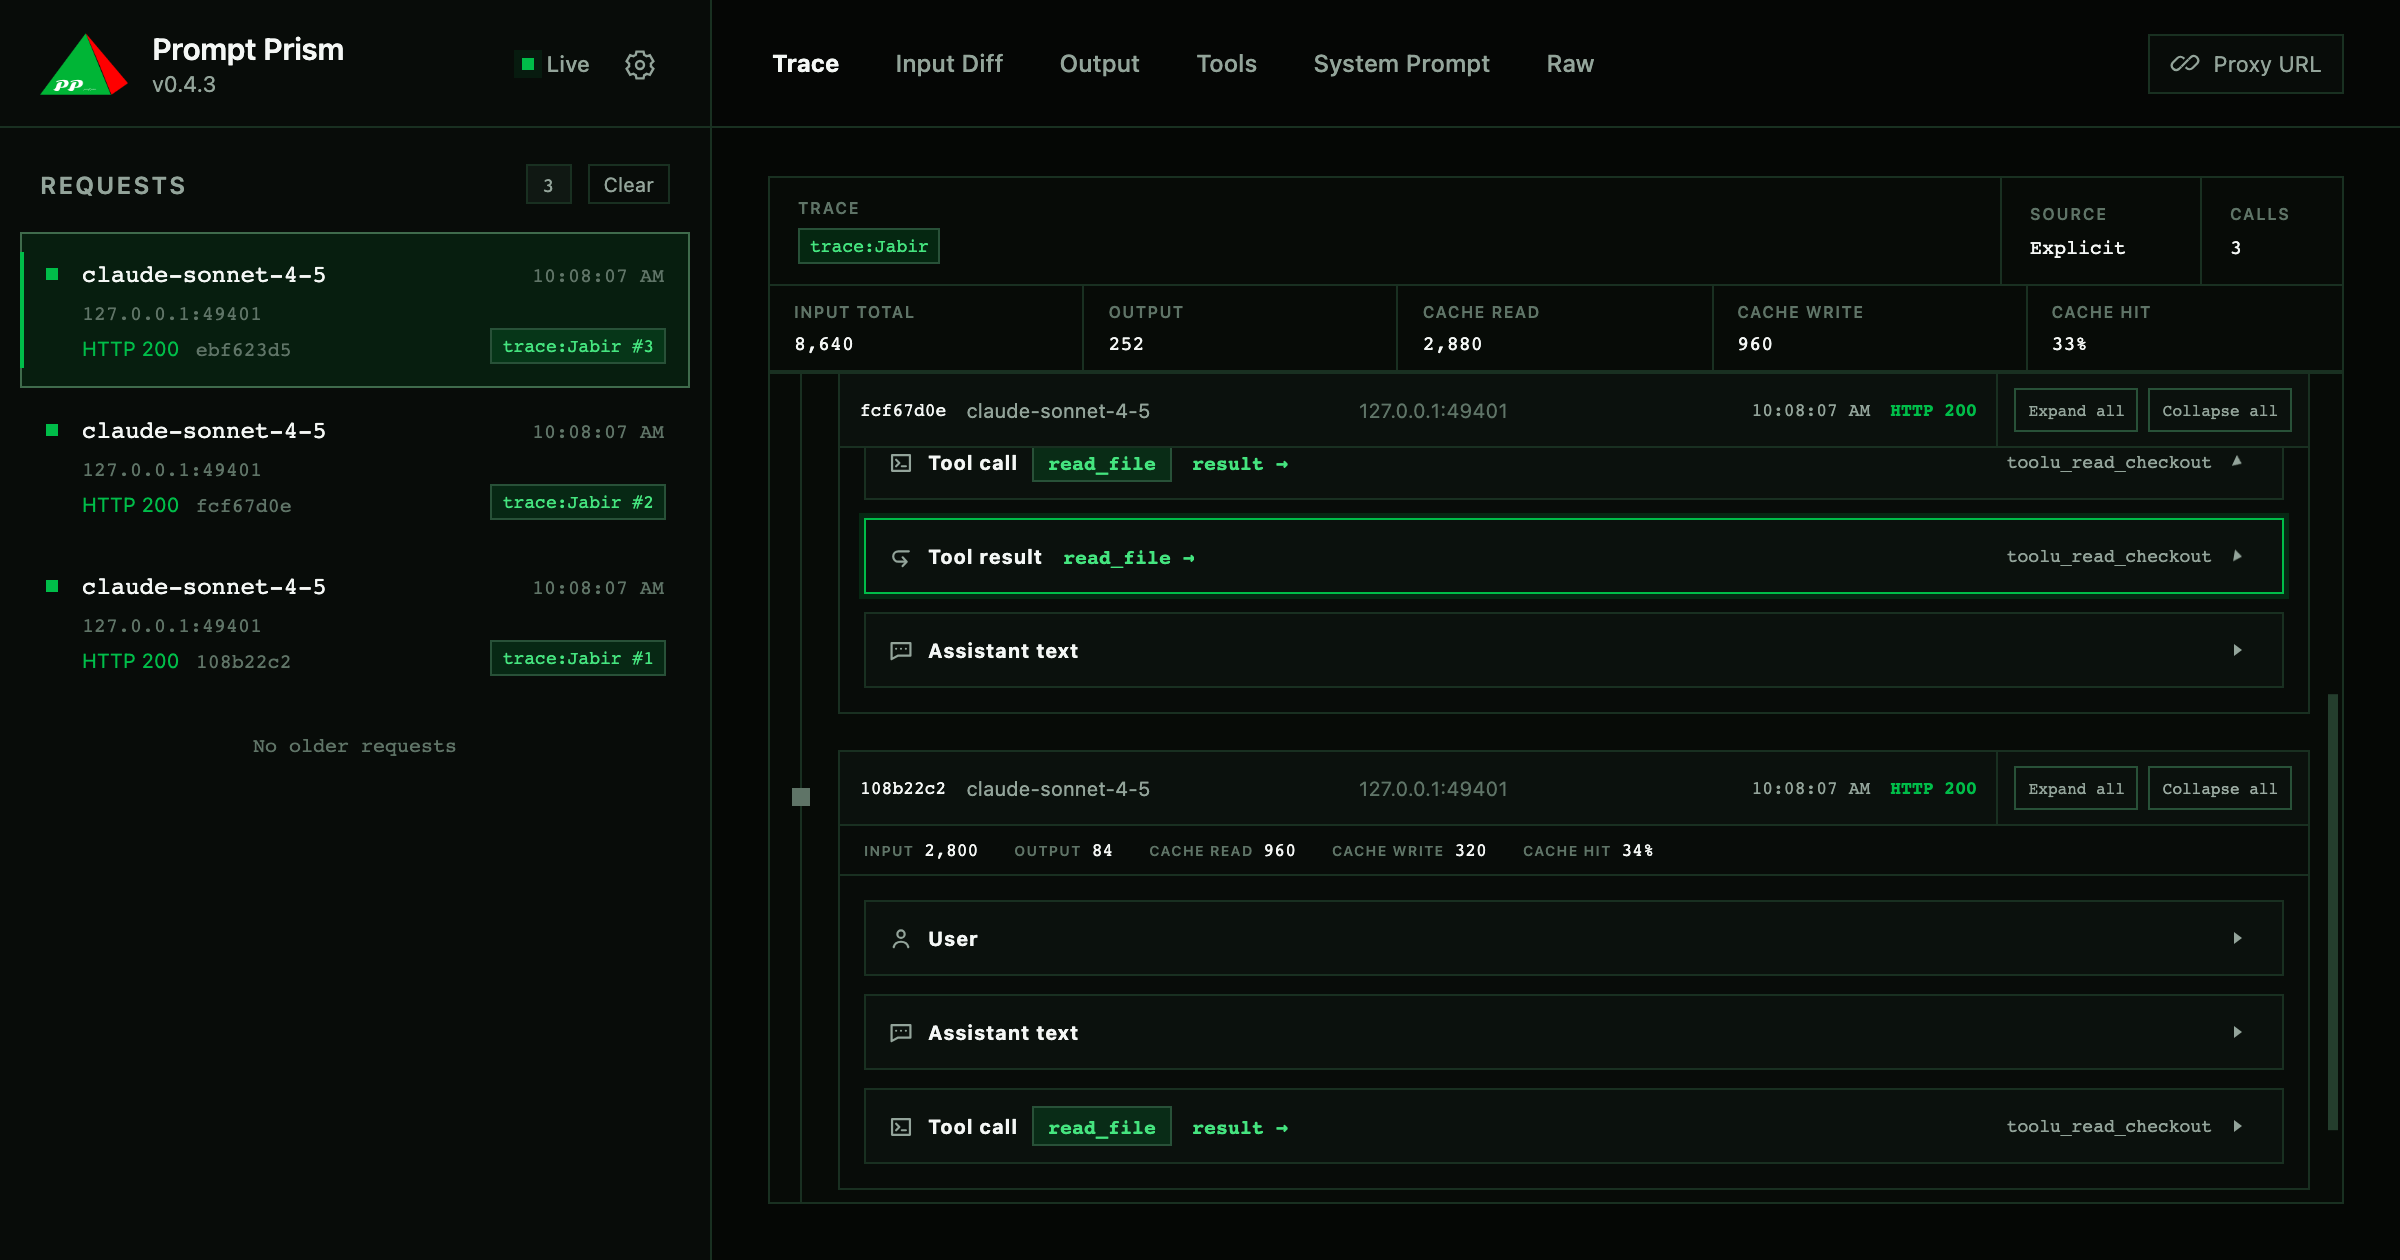
Follow user input, reasoning, assistant text, tool calls, and tool results across captures. Jump between linked events and reveal the real parameters.
 Prompt Prism
Local Agent debugging
Built for Agent developers, Prompt Prism reveals prompt changes, normalized model output, tool activity, and complete multi-request traces through a transparent local proxy.
npm install -g prompt-prism
Node.js 20+ · MIT licensed · zero runtime dependencies
01 / Inspect
Move from the request list to the exact tool arguments without reconstructing events from raw logs.
Follow user input, reasoning, assistant text, tool calls, and tool results across captures. Jump between linked events and reveal the real parameters.
Input Diff locates inserted and removed messages, then compares System, Tools, and request options.
Browse declared schemas and parsed parameters, then jump from usage totals to each actual call in Trace.
Inspect text, reasoning, usage, errors, stop reasons, and provider-neutral tool arguments.
Unsupported traffic still passes through and remains available as a redacted HTTP request and response.
02 / Transparent
SSE and JSON responses are forwarded immediately. Capture and analysis happen on a side channel.
03 / Compatible
Automatic detection resolves each capture independently, so one protocol never locks or affects the next.
04 / Local by design
Captures are stored under your local data directory. Authentication headers and cookies are redacted before storage, and the oldest captures are evicted when the configured limit is reached.
05 / Start
Start Prism, generate a Proxy URL, and configure it as your Agent's model API target through its framework, SDK, CLI, environment, or HTTP client.
# install
npm install -g prompt-prism

# start the local proxy
p2 start

# open the Dashboard and click Proxy URL
http://127.0.0.1:1028/_pp/
06 / Go deeper
Open source · MIT